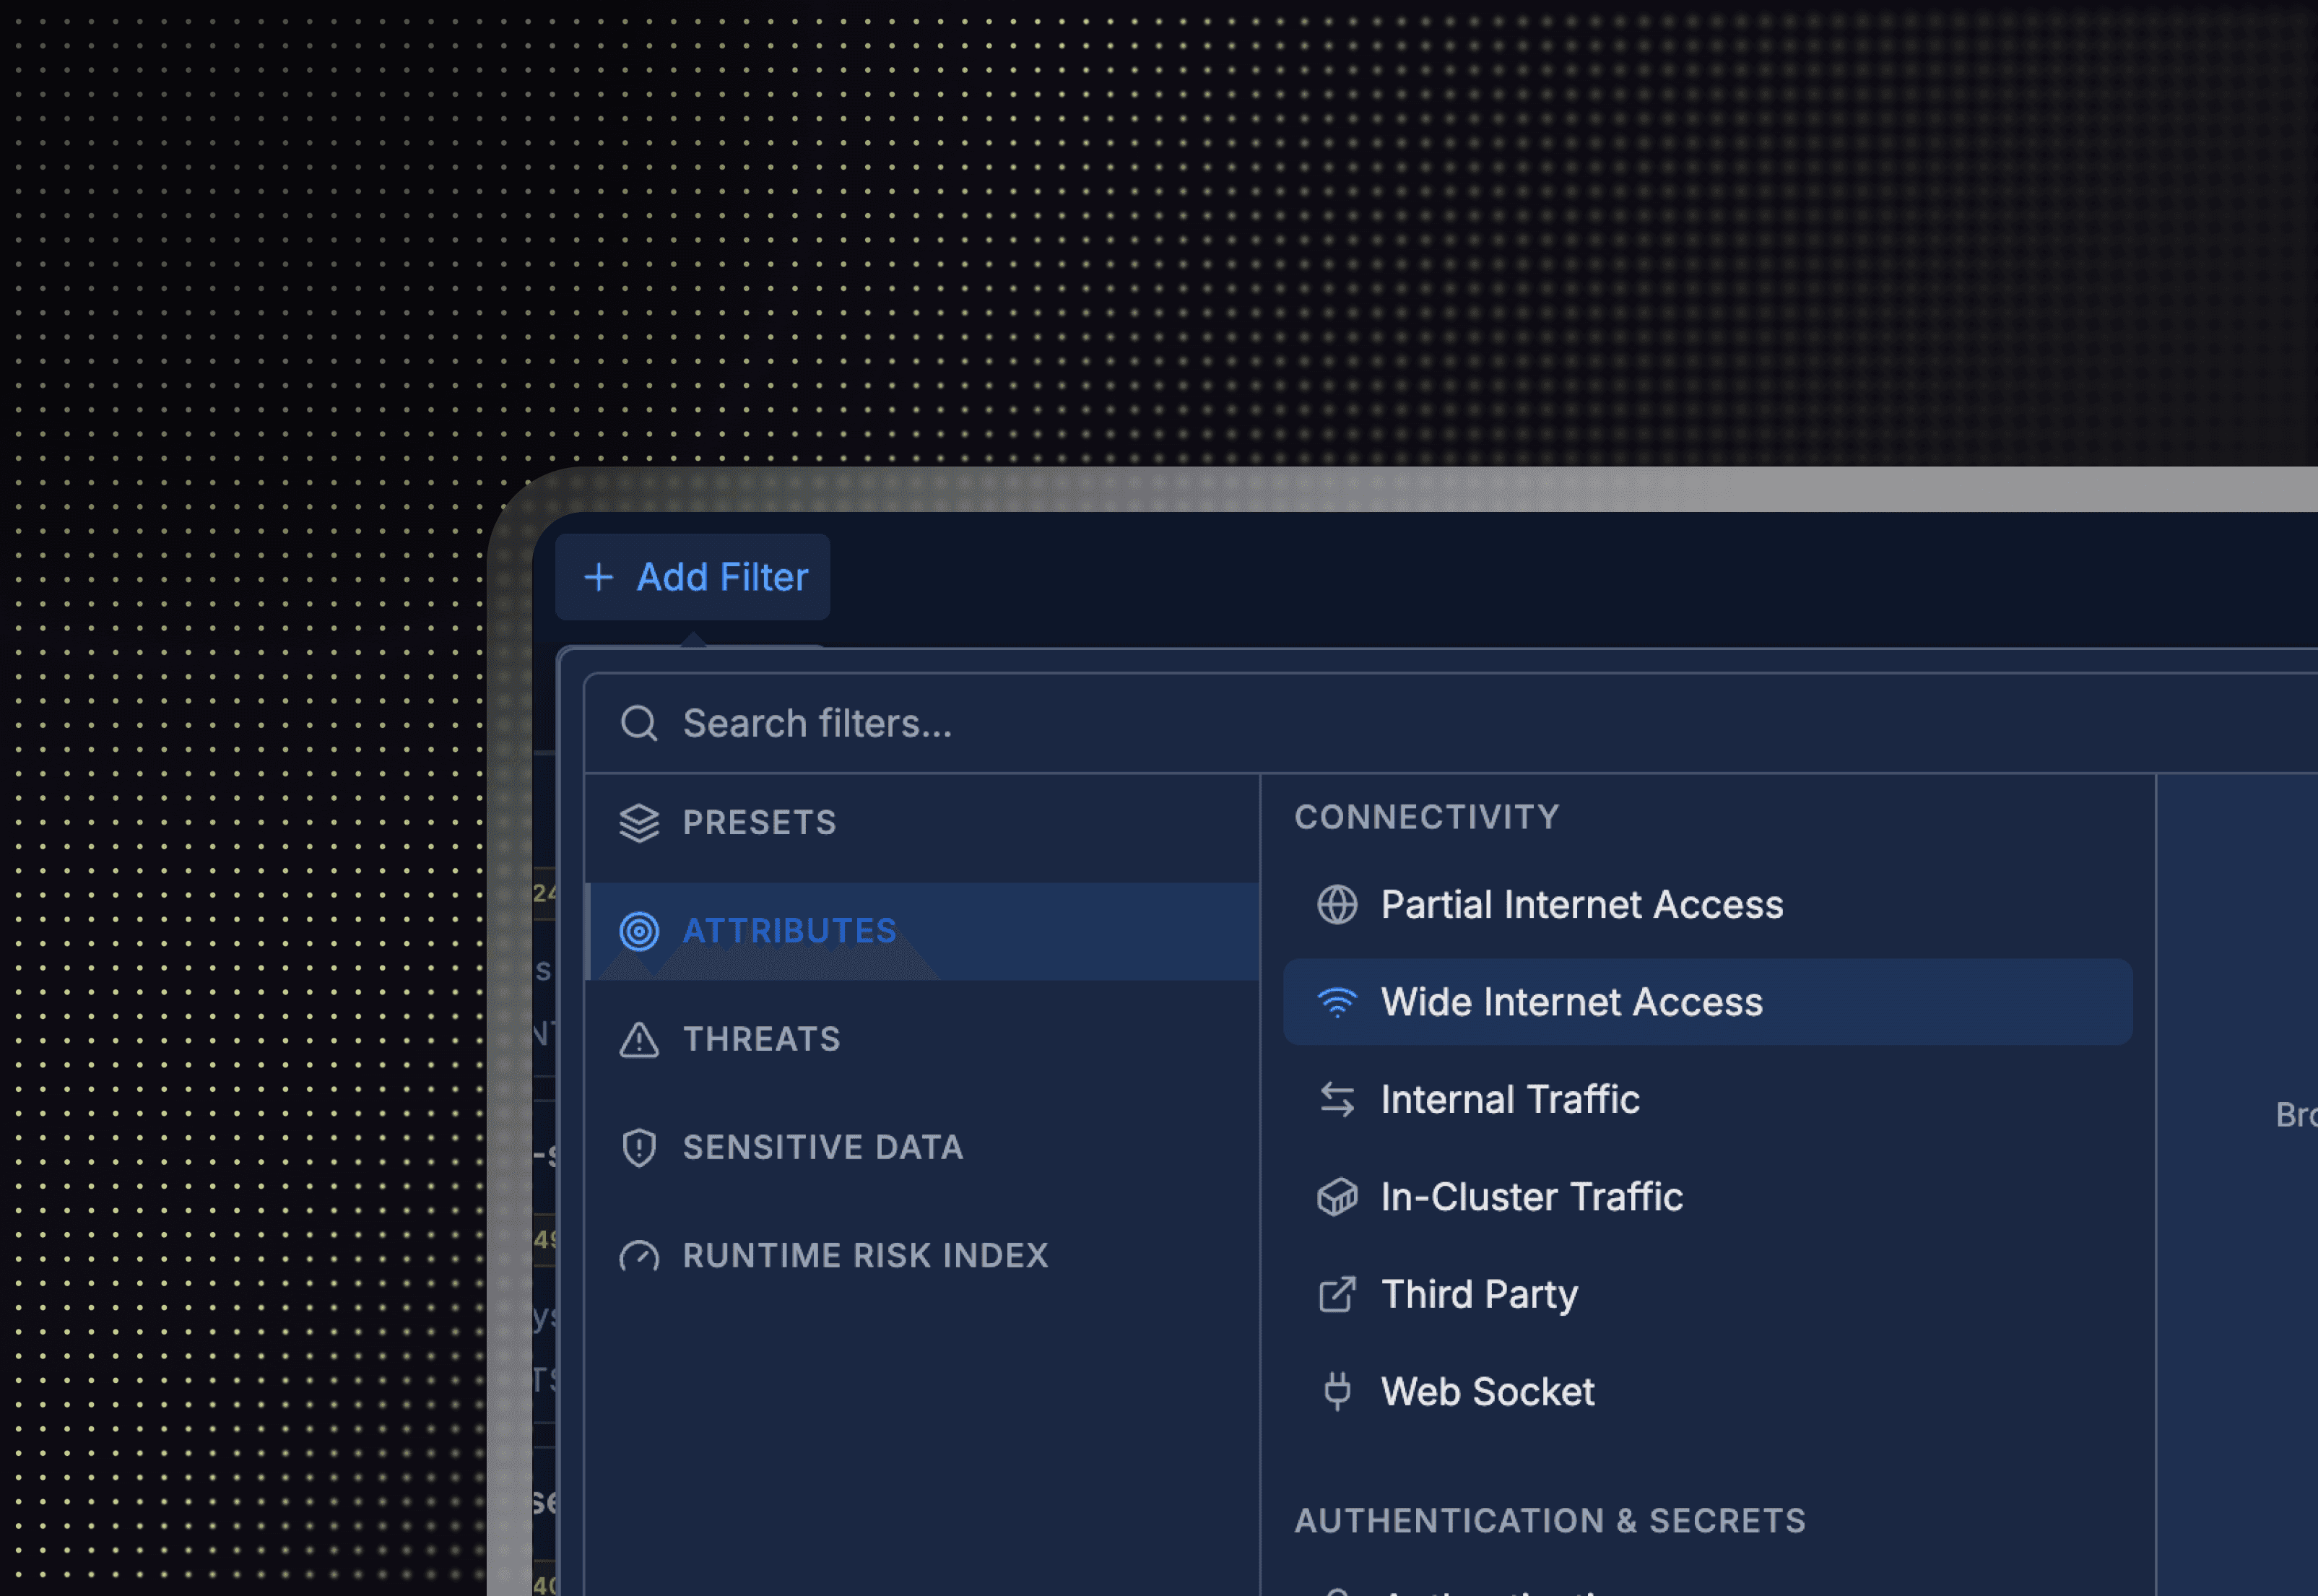
Sensitive Data Display Tab
Project Overview
Alma's eBPF sensor can detect sensitive data such as PII, PCI, PHI, secrets, as it moves through inbound and outbound traffic. The challenge was turning that raw detection capability into something SecOps teams could actually use: a structured view that tells them what was found, where it lives in the request or response, which component it touched, and whether it was supposed to be there at all.
// My Role
I identified the problem myself and designed the full experience from category architecture to table-level detail.
I noticed that while the sensor was capable of detecting sensitive data in traffic, nothing in the platform made that visible in a meaningful way. I framed the problem, defined the category structure, and designed the detection table and parent component hierarchy end-to-end.
// Problem
Sensitive data was visible in the platform but unstructured, unsegmented, and hard to make sense of.
Alma's eBPF sensor was already detecting sensitive data in traffic PII, financial data, health records, secrets. It was surfaced in the platform, but with no organization around it. Everything landed together with no way to distinguish category, no clear hierarchy, and no structure to help SecOps teams understand what they were looking at or where to start. On top of that, the aggregated and single-item views existed but were toggled from a control tucked in the far right invisible to most users, who never knew two table states existed at all.
4
sensitive data categories mixed together with no segmentation
No
hierarchy between Personal, Financial, Health, and Secrets data
Hidden
aggregated vs single toggle — far right, overlooked, effectively unused
// Research
I mapped every dimension of the detection data before designing a single screen.
I started by understanding what the sensor actually captured, not just the category of sensitive data, but all the context around it: which component handled it, which endpoint and path it came through, which port, the payload location (request headers, response headers, request body, response body), the exact field name, and the hostname.
That full map became the foundation for every design decision.
4
top-level categories defined: Personal, Financial, Health, Secrets
8+
data dimensions mapped per detection event
4
payload locations tracked: req headers, res headers, req body, res body
Key Insight
Knowing that sensitive data was detected isn't enough. SecOps teams need to know exactly where it was which field, in which part of the request or response, on which path to understand whether the exposure is intentional, misconfigured, or a genuine risk.
Design Opportunity
How might we surface sensitive data detections in a way that tells SecOps teams not just what was found but exactly where it lives, which component touched it, and whether it should be there at all?
Early Concepts
I explored how to handle the breadth of the detection data without overwhelming users on first load. A parent component per category Personal, Financial, Health, Secrets gave teams a way to scope their investigation before entering the table. For the aggregated vs single state problem, instead of a toggle users had to find, I used an accordion: aggregated rows are the default view, and expanding a row reveals the individual detections underneath. The state switch became part of the interaction itself.
A small widget that doesn’t adequately address the sensitive data identified in the customer’s environment.
A table lacking both segmentation and aggregation, making it difficult to understand what’s going on.
// Final Product
Four detection categories, a precision table, and an accordion that makes both views discoverable, shipped and in production.
The shipped feature organizes all detections under four parent categories. Within each, the detection table shows sensitive data in aggregated state by default component, path, endpoint, and port. Expanding any row reveals the individual detections underneath, replacing what used to be a hidden toggle in the far right with an interaction users naturally discover. Payload location tells them exactly where in the traffic the data was found: request headers, response headers, request body, or response body, down to the exact field name and hostname.
Category view
Personal, Financial, Health, and Secrets as top-level parent categories
Detection table
Aggregated table, component, path, endpoint, port visible at a glance
Payload detail
Payload location, req/res headers or body, exact field name and hostname
// Impact
SecOps teams can now see exactly what sensitive data is flowing and where, without a dedicated DSPM tool.
The feature shipped and is actively used. Alma isn't a DSPM but by surfacing sensitive data from live traffic at the eBPF level, teams get detection coverage that traditional tools miss entirely. Exposure that would have gone unnoticed in transit is now visible, categorized, and actionable.
4
detection categories covering PII, PCI, PHI, and secrets in one unified view
Field
level precision exact location in the request or response, not just the category
Shipped
in production, covering inbound and outbound traffic across components
Key Learning
Knowing sensitive data exists in traffic isn't enough — teams need the exact field, location, and context to decide whether it's a risk or expected behavior.
If a feature requires users to find a toggle to unlock its full value, most users never will — the interaction itself should reveal the states.
Category architecture before table detail is the right order — it gives users a mental model before the data volume hits them.
eBPF-level visibility creates detection opportunities that purpose-built tools miss — the sensor sees the data in motion, not just at rest.